Storyteller Indicator
Spot momentum shifts, reversals and counter-trend opportunities using the histogram signals that tell the story behind price.
Momentum Trigger
Light/dark histogram signals
Reversal Alerts
Spot when momentum fades
Counter-Trend Setup
For experienced traders
Screener
Scan multiple markets
Momentum Trigger
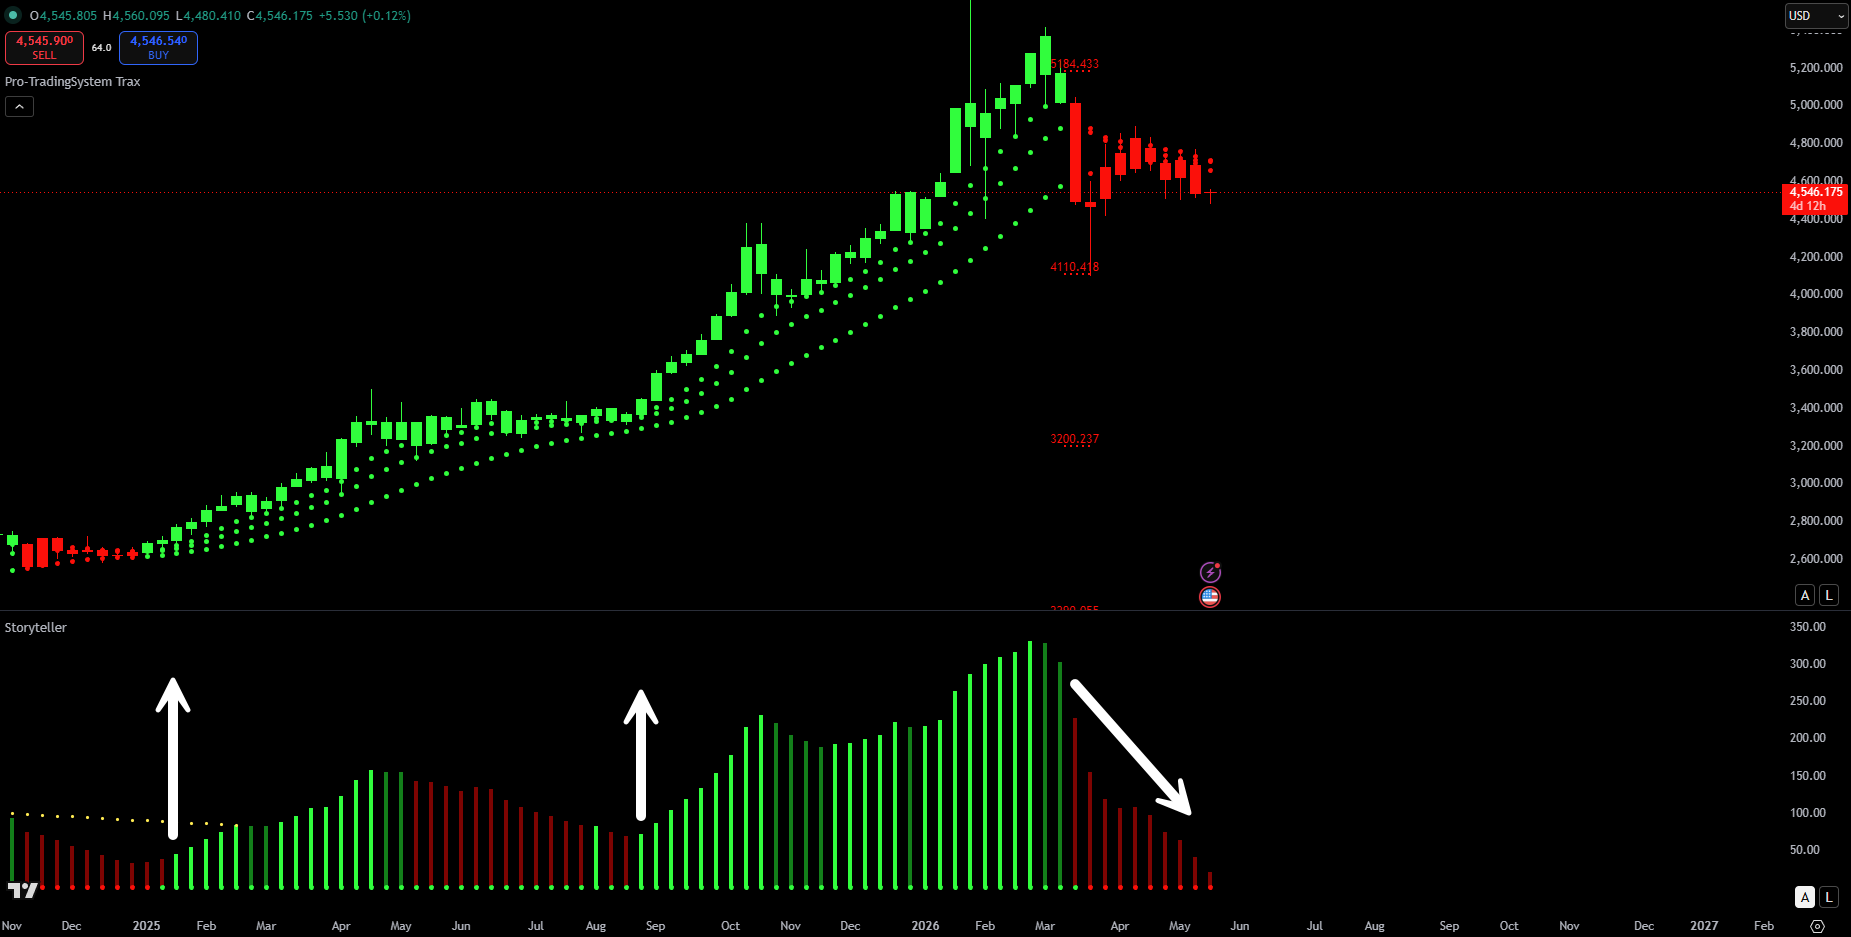
Green bars above zero can highlight long momentum. Red bars help identify short momentum and potential exits.
2 & 3 Wave Setups
Divergence lines show when price and momentum are no longer agreeing, creating possible reversal setups.
Counter-Trend Trades
For more advanced traders, the Storyteller can highlight when momentum is fading against the current move.
Automatic Scanner
The screener can watch multiple instruments and timeframes so users are not manually turning every chart.
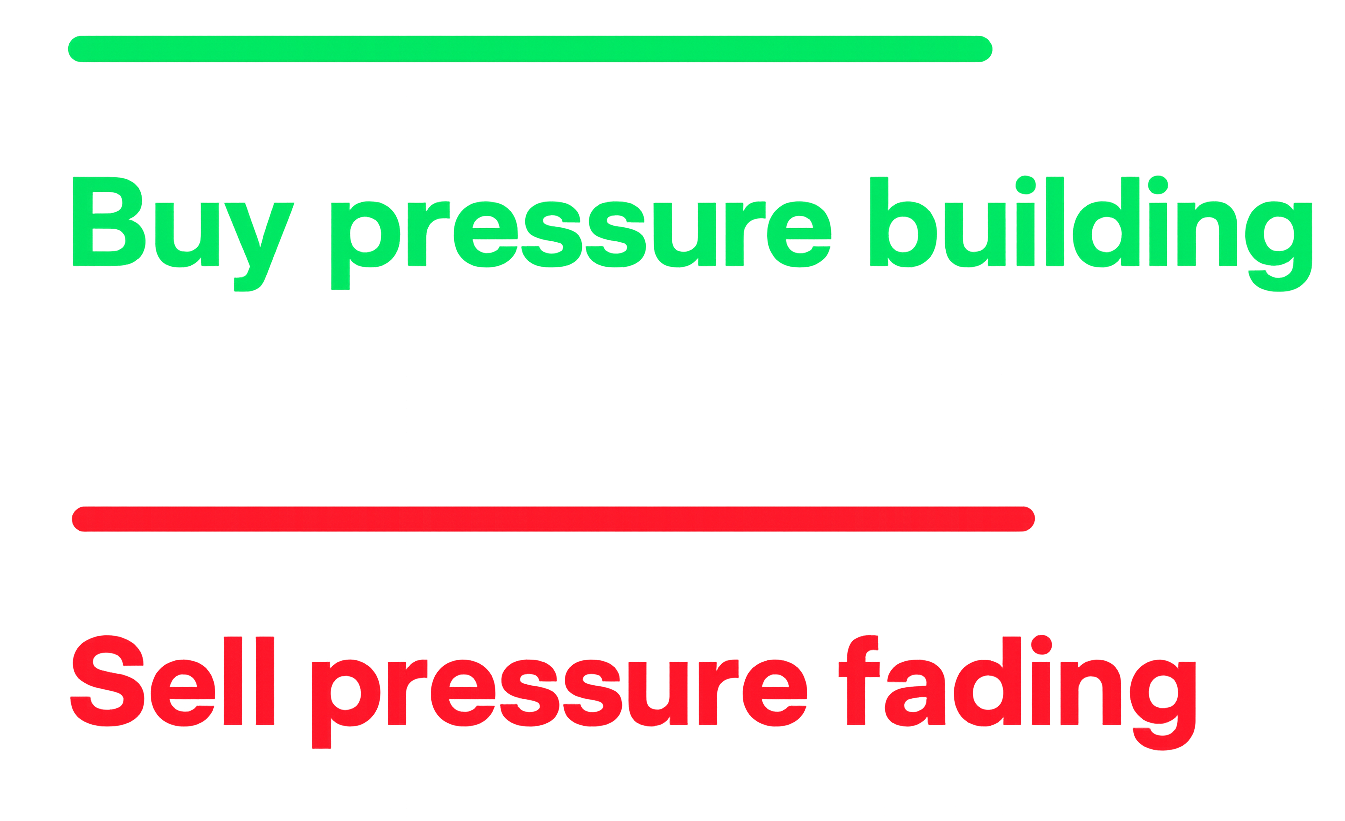
See when momentum is building, fading or reversing before you take the trade.
Momentum signals
Grade A and B momentum examples
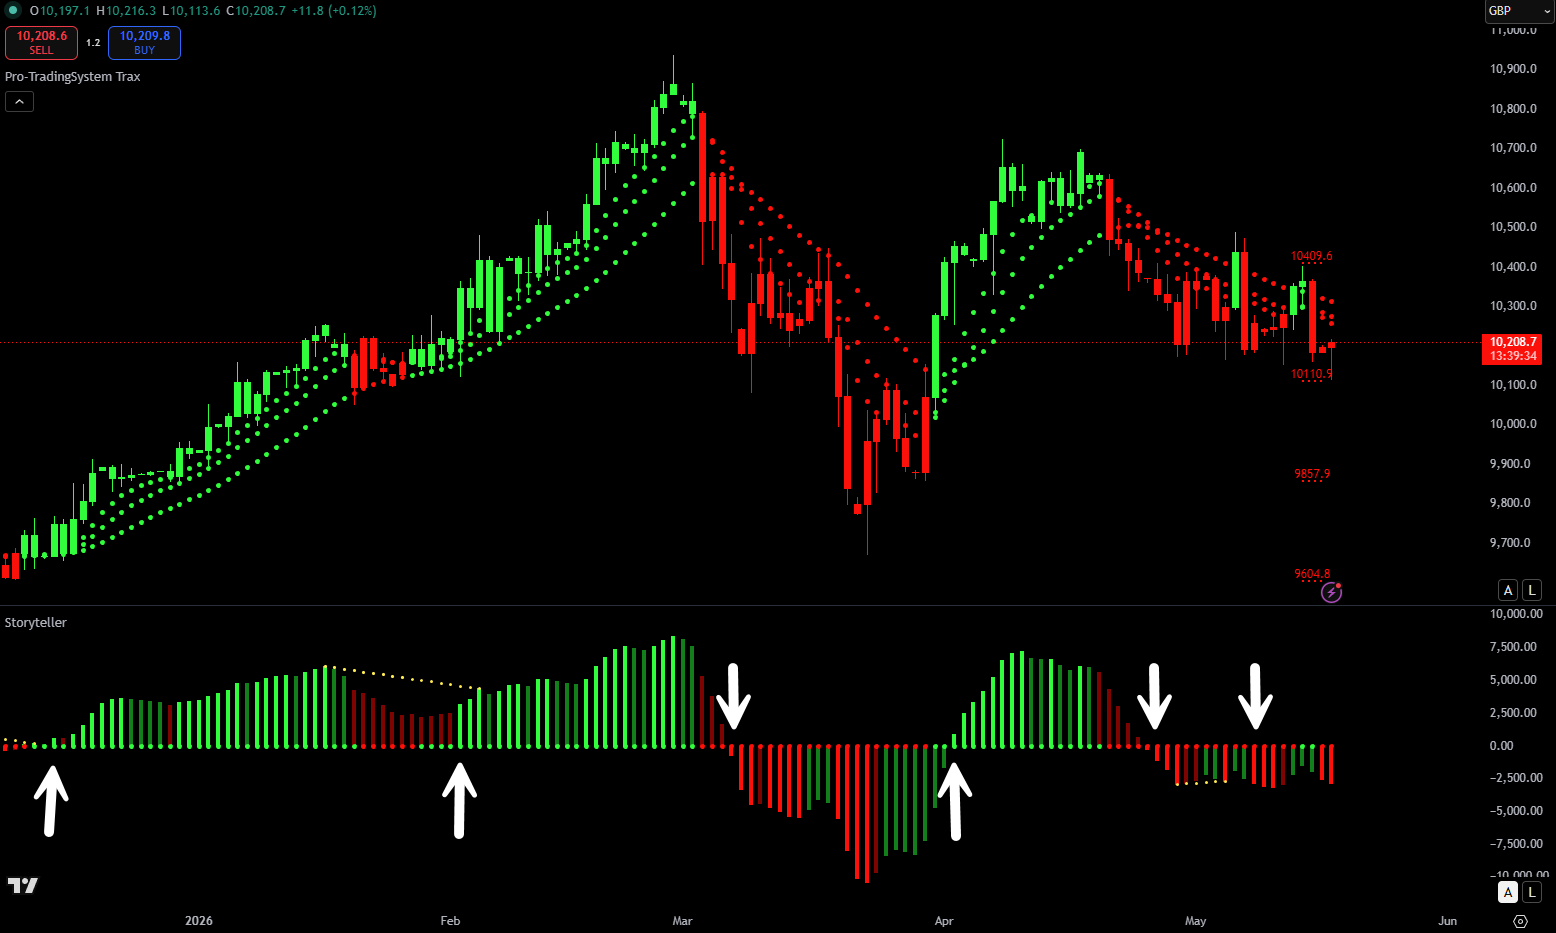
Swing trading signals
Bigger timeframe buy signals
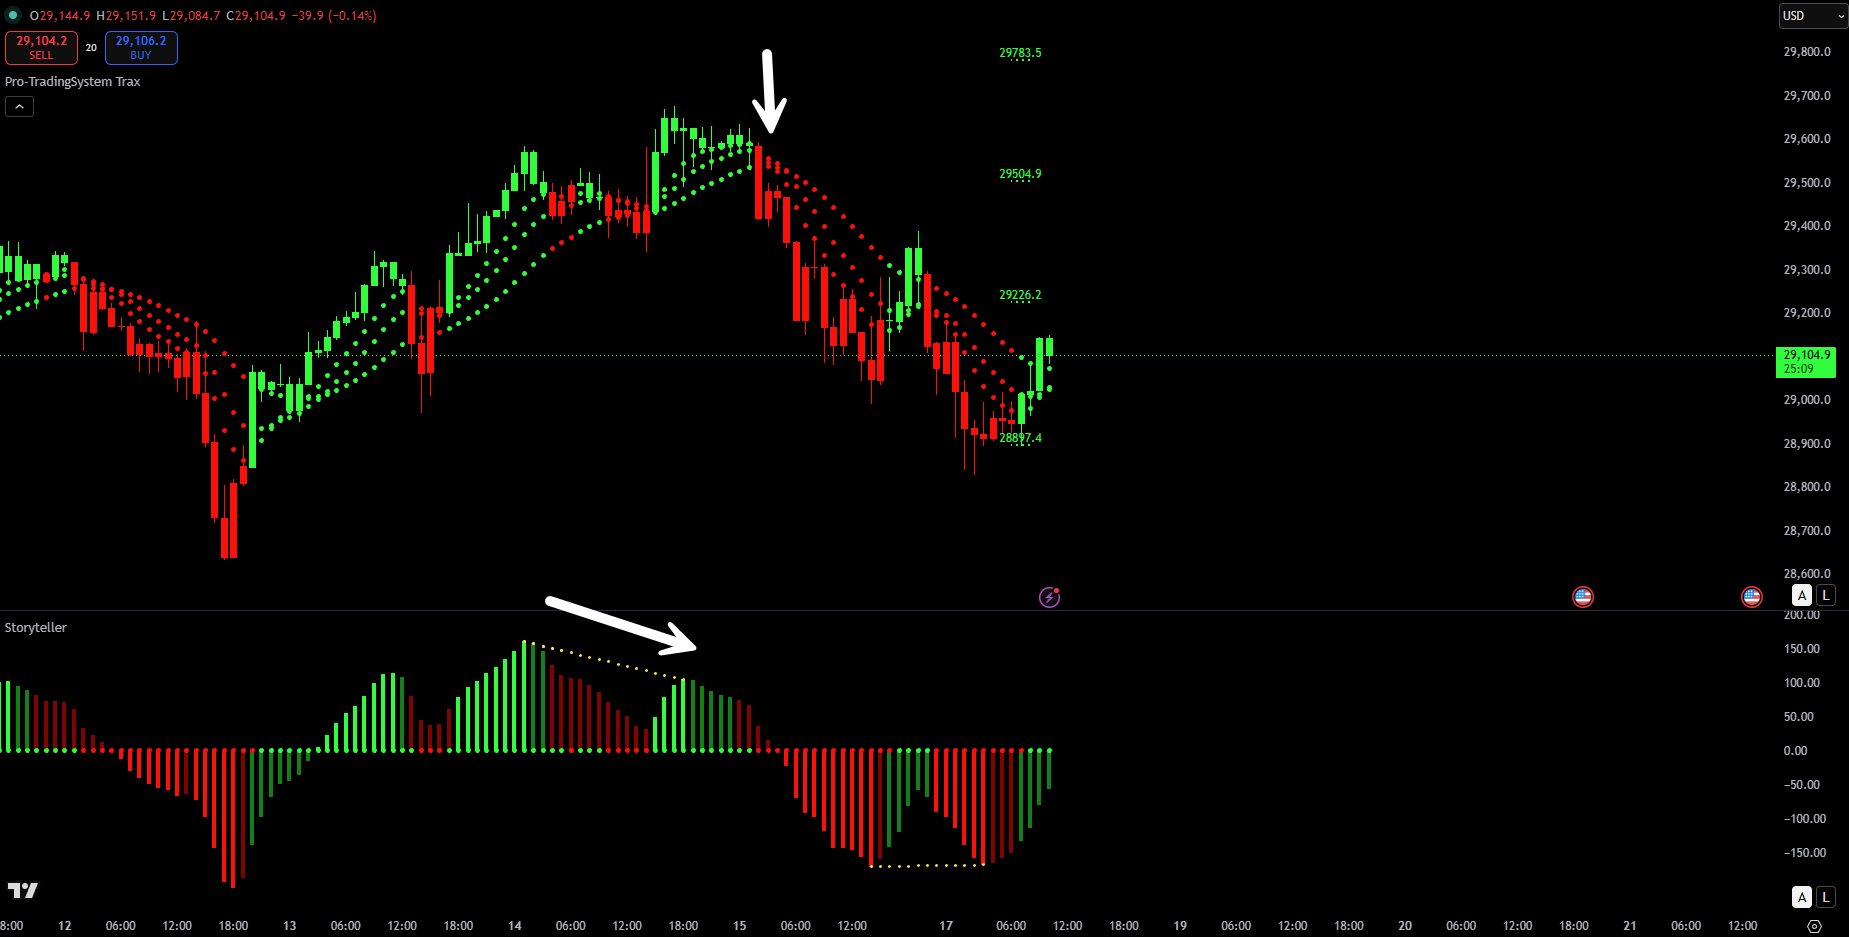
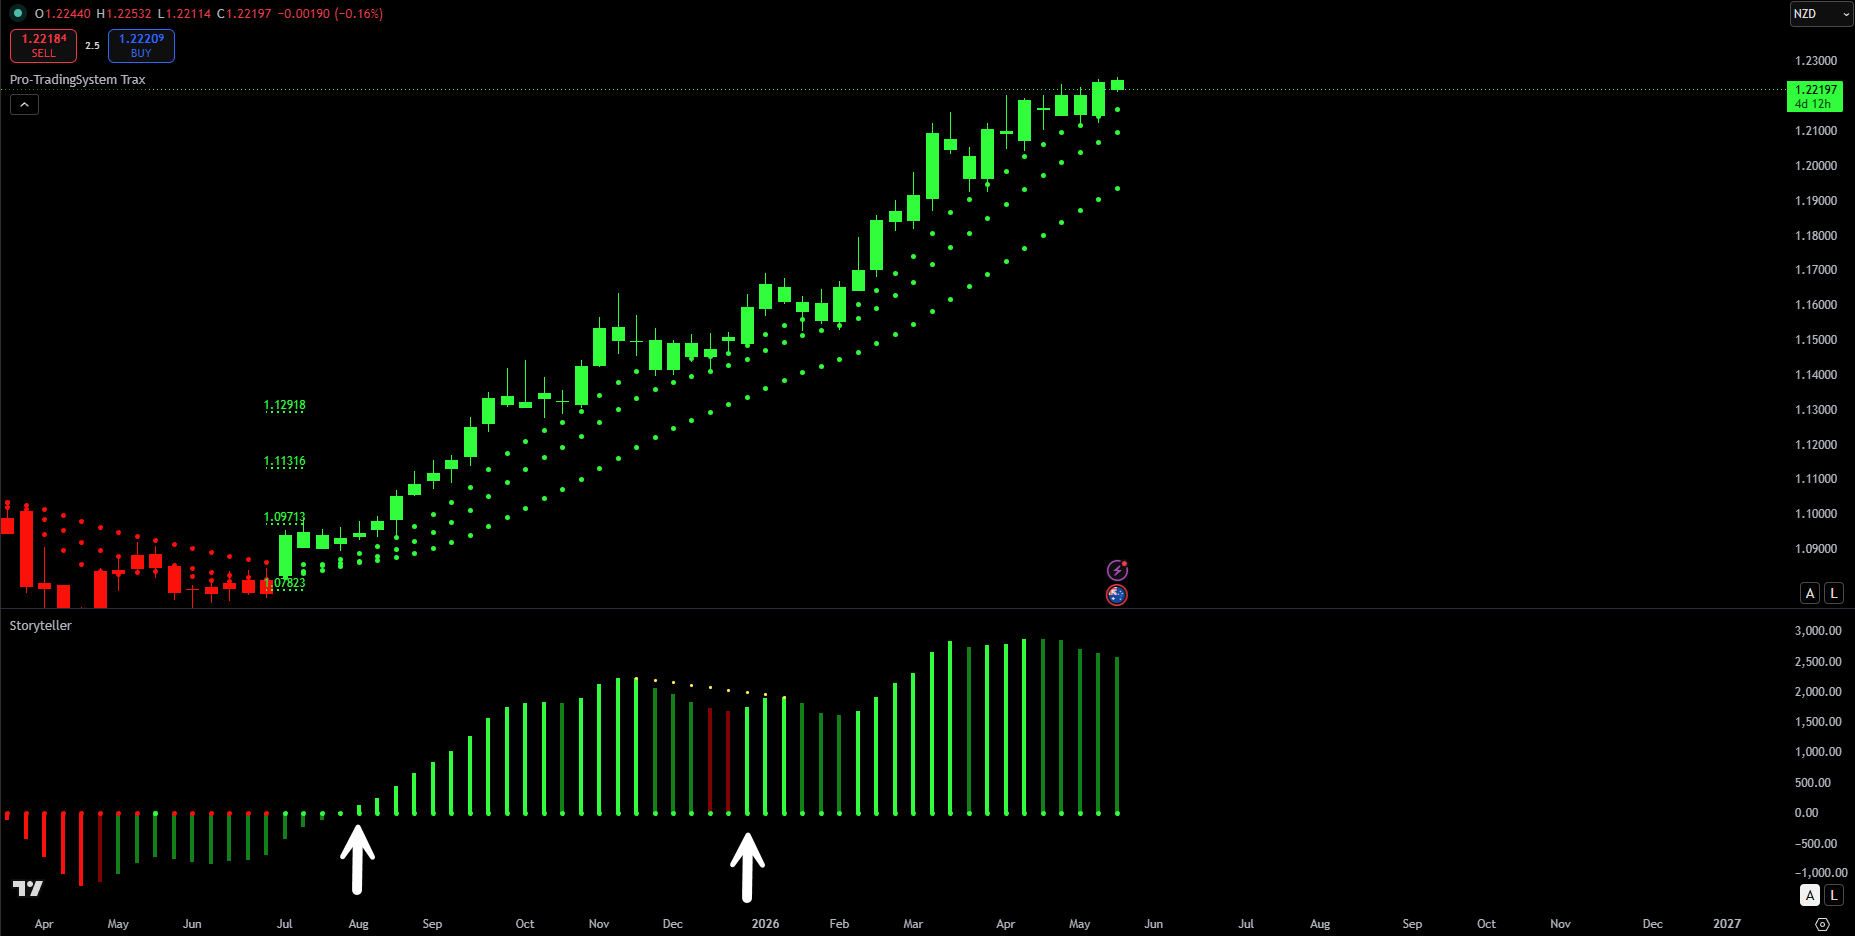
Reversal setups
Spot momentum turning points
Counter-trend example
Buy and counter-trend signal examples
01
Read the colours
Light and dark green/red histogram colours show whether momentum is strengthening, weakening or changing direction.
02
Confirm the signal
Use momentum triggers, divergence waves or counter-trend conditions once the signal has closed and confirmed.
03
Manage the trade
Use the TP/SL moving average area, stop discipline and exit rules when the signal changes.
Reversal / FX example section
Use a full-width real example to break up the page and make the indicator feel practical rather than theoretical.

LIMITED-TIME STORYTELLER SALE
Get the Storyteller Indicator
Indicator access, manual, signal guide and framework for reading momentum, reversals and counter-trend setups.
- Storyteller Indicator access
- Momentum Trigger strategy
- Counter-trend training notes
- Scanner is NOT available for TradingView
- Available in ProRealTime and TradingView
- 2 & 3 wave reversal examples
- Automatic screener guidance